
When everyday investors explore mutual funds in search of long-term wealth creation, the financial industry presents a dazzling spectacle: thousands of competing schemes, glowing 5-star ratings, and glossy advertisements claiming: "Our star fund manager will beat the market by 20%!"
Yet in 2007, the world's most famous investor, Warren Buffett, issued a historic public challenge to leading US hedge fund managers: "Over a 10-year period, no group of highly compensated active fund managers can beat the net return of a low-cost, unmanaged S&P 500 index fund."
When the wager concluded in 2017, Buffett's chosen index fund had gained 125.8%, while the competing active funds averaged a modest 36% after accounting for fees!
Following SEBI's structural mutual fund re-categorization in 2018, this exact same mathematical reality is playing out across the Indian stock market.
"Should you pay hefty management fees to active fund managers hoping for market-beating returns? Or should you allocate capital to low-cost Nifty 50 and Nifty Next 50 index funds that mirror the market with total transparency?"
This guide explores the hidden compounding impact of expense ratios (the ₹50L+ drag), the findings of the SPIVA India scorecard, tracking error analysis, and how to build a resilient index-led equity portfolio.

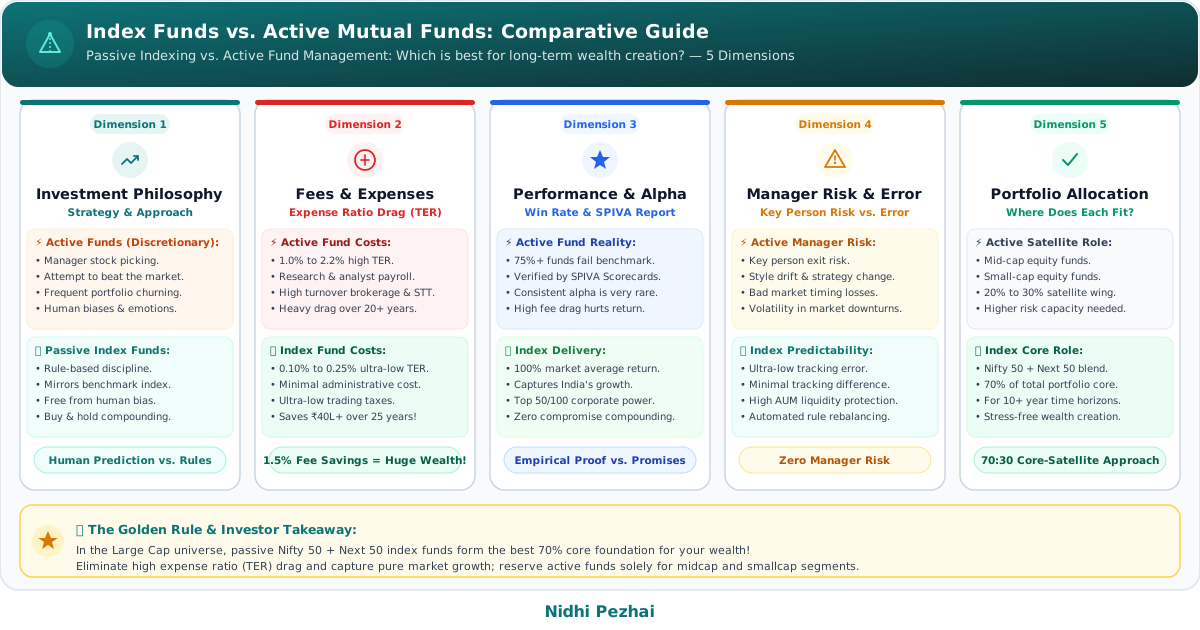
1. Core Concepts: Active Management vs Passive Indexing
Before deploying capital into mutual funds, you must distinguish between two fundamentally different investment philosophies: Active Management vs Passive Index Investing.
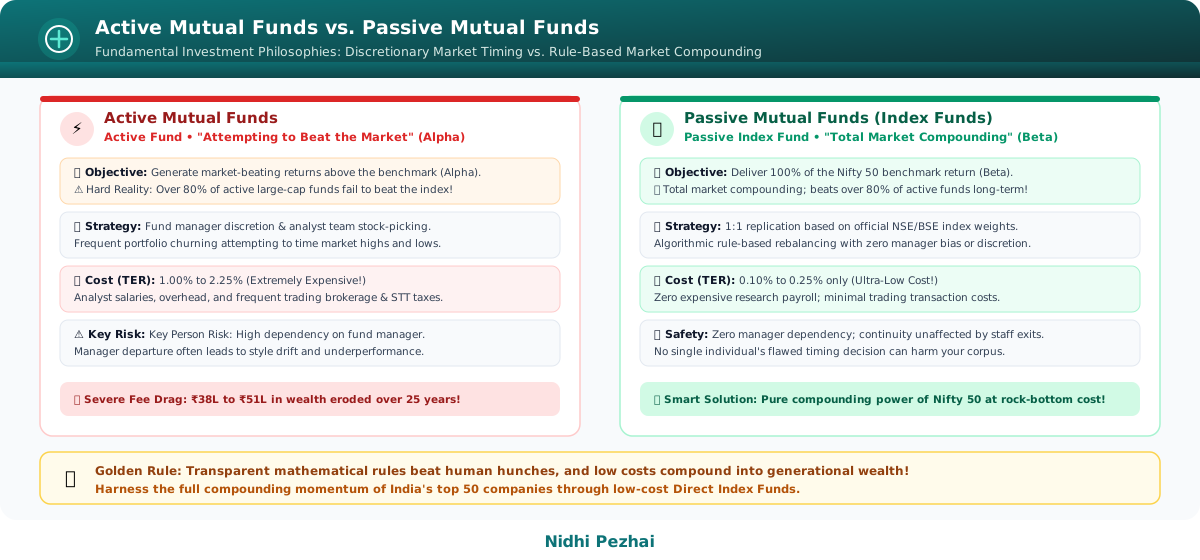
Active Mutual Funds: "The Quest to Beat the Market"
- How It Works: A fund manager supported by a team of research analysts analyzes financial statements, conducts channel checks, and buys and sells stocks in an attempt to predict which companies will outperform.
- The Objective: Outperform the underlying benchmark index (delivering excess returns known in financial theory as "Alpha").
- The Cost: To pay for research teams, executive compensation, marketing overhead, and frequent transaction churning, the fund deducts a substantial annual Total Expense Ratio (TER) of 1.0% to 2.25% directly from the fund's assets.
Passive Index Funds: "The Wisdom of Owning the Entire Market"
- How It Works: The fund manager exercises zero personal discretion or subjective forecasting. For example, a Nifty 50 Index Fund simply buys the 50 constituent companies of the National Stock Exchange (NSE) index in the exact market-capitalization weights assigned by the index committee.
- The Objective: Faithfully replicate the returns of the target benchmark index (capturing pure market return, known as "Beta") with minimal deviation.
- The Cost: Because no stock pickers or research teams are needed, the expense ratio is negligible (typically 0.10% to 0.25%). Crucially, the fund is immune to "key-person risk"—if the fund manager resigns or makes a bad forecast, your portfolio remains unaffected.
2. The SPIVA India Report: The Harsh Reality of Large-Cap Active Funds
Many investors raise a seemingly logical question: "Even if an active fund charges 1.5% more in fees, isn't it worthwhile if a skilled fund manager delivers 3%–4% higher returns than an index?"
Theoretically, yes. But what does empirical evidence tell us about the Indian market?
To answer this objectively, S&P Dow Jones Indices publishes the semiannual SPIVA (S&P Indices Versus Active) India Scorecard, rigorously comparing active mutual funds against their official benchmark indices across 1, 3, 5, and 10-year periods.
SPIVA India Scorecard (Large-Cap Equity Funds):
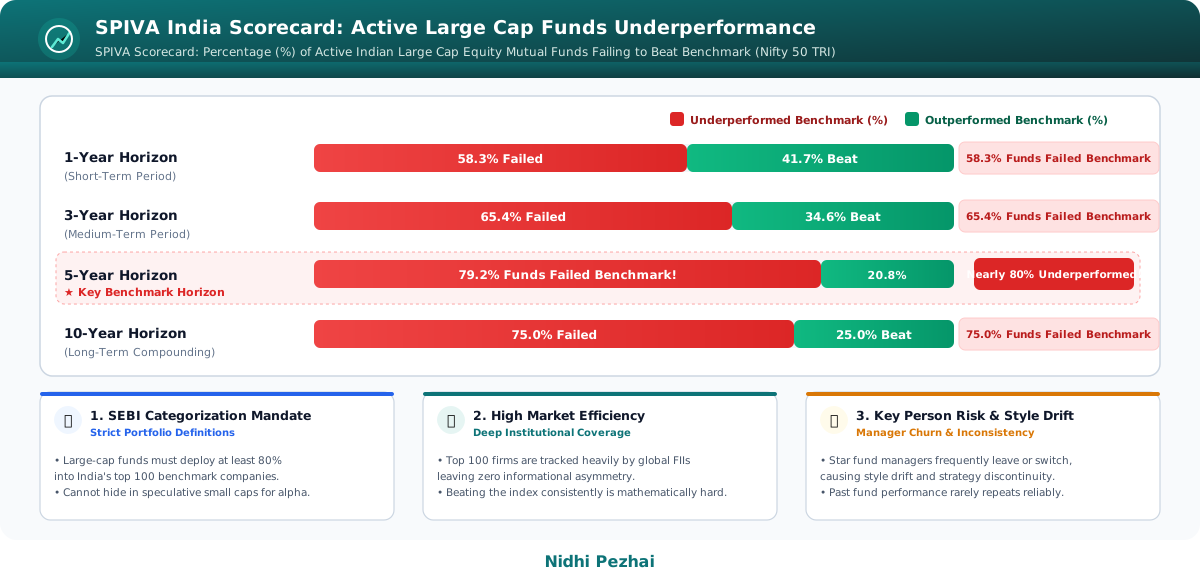
The Empirical Reality: Over long-term investment horizons (5 to 10 years), between 75% and 85%+ of active large-cap funds underperform their benchmark index! Investors pay premium fees for alpha, yet end up with returns below the simple market average that a low-cost index fund effortlessly delivers.
🔍 Deep Dive: Why Did Active Funds Win Before 2018, and Why Do They Underperform Today? (3 Primary Drivers)
Articles published in 2015 or 2016 frequently claimed that "active funds in India consistently generate alpha over index funds." While that held true in an earlier era, the institutional landscape has changed permanently. Here is why:
-
SEBI Categorization Circular (2017/2018):
Prior to 2018, fund managers running "large-cap" schemes routinely allocated 30%–40% of their portfolios to mid-cap and small-cap stocks, manufacturing synthetic outperformance. In October 2017, SEBI mandated that large-cap funds must invest at least 80% of their total assets strictly in the top 100 companies by market capitalization. This closed the loophole of generating artificial alpha by taking hidden mid-cap risks. -
Market Information Efficiency:
The top 50 to 100 Indian companies (Reliance, TCS, HDFC Bank, Infosys, etc.) are scrutinized around the clock by thousands of institutional research analysts, domestic mutual funds, and foreign institutional investors (FIIs). There are no informational blind spots left to exploit. With information symmetry, consistently outsmarting the market in large caps has become mathematically improbable. -
"Star Fund Manager" Turnover & Style Drift:
A fund may perform admirably for 3 to 5 years, only for its star manager to be recruited by a competitor or launch their own PMS/AIF. The replacement manager frequently reshuffles the portfolio, triggering capital gains, transaction costs, and style drift. Passive index funds eliminate key-person dependency entirely.
3. The Compounding Expense Ratio Drag & Mathematical Simulation
Investors often dismiss fee differences: "What difference does a 1.5% fee make? Isn't it just ₹1.50 for every ₹100?"
This is one of the most deceptive cognitive biases in personal finance. Just as returns compound exponentially over decades, fees also compound exponentially against you!
- A fund's Expense Ratio is not deducted once a year from your profits.
- It is deducted daily directly from the fund's Net Asset Value (NAV) across your entire accumulated corpus, whether the market rises, stagnates, or crashes!
25-Year Simulation: ₹10,000 Monthly SIP
- Gross Market Growth Rate: 12.0% CAGR
- Option A: Direct Passive Index Fund (TER: 0.15% -> Net Growth: 11.85%)
- Option B: Active Direct Plan (TER: 1.50% -> Net Growth: 10.50%)
- Option C: Active Regular Plan (including distributor commission, TER: 2.00% -> Net Growth: 10.00%)
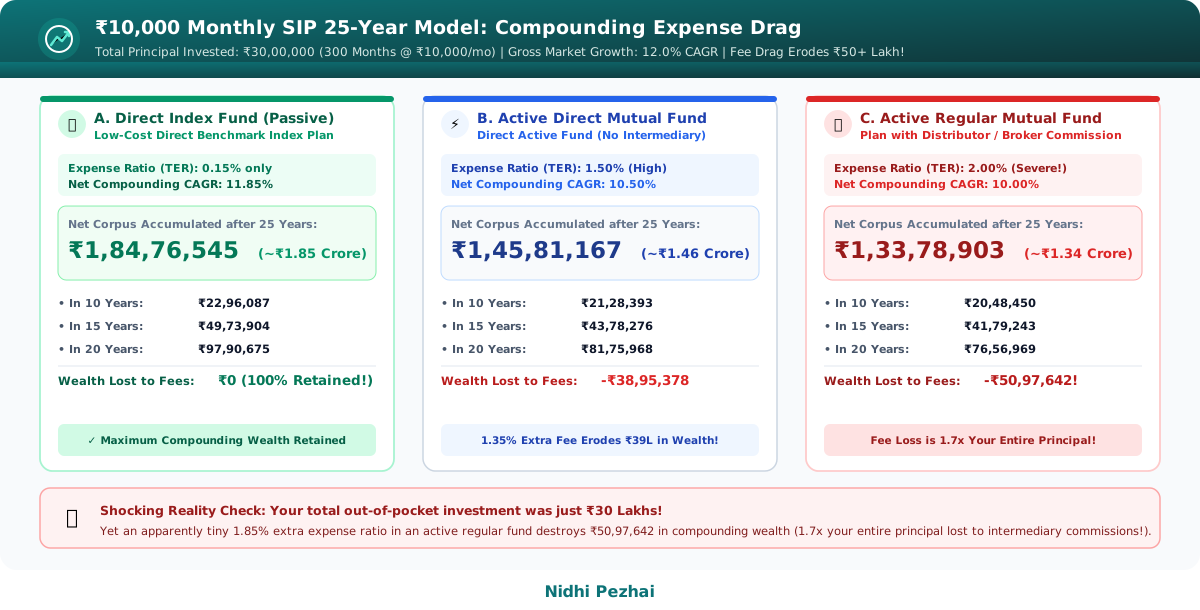
🔍 Two Shocking Takeaways from This Mathematical Model (Click to Expand):
- You Pay More in Fees Than Your Entire Invested Capital!
- Over 25 years, your total out-of-pocket investment principal is ₹30 Lakh (₹10,000 × 300 months).
- In an Active Regular plan, the opportunity cost lost strictly to the 1.85% fee gap is ₹50,97,642!
- You surrender 1.7 times your entire principal to intermediaries and fund houses in administrative fees.
- Even Active Direct Plans Surrender ₹38.95 Lakh!
- Even if you invest directly without agents, the 1.35% active management fee consumes nearly ₹39 Lakh of your terminal wealth.
- For an active fund manager to make up this ₹39 Lakh gap, they must outperform the benchmark by at least 1.5% every single year for 25 consecutive years—a feat that 80%+ of fund managers fail to achieve according to SPIVA.
4. Tracking Difference and Tracking Error: How to Evaluate Index Funds
Once convinced of the benefits of passive investing, some investors make a common mistake: "All index funds buy the Nifty 50, so any fund will do."
In practice, execution efficiency matters. Two technical metrics distinguish top-tier index funds from mediocre ones:
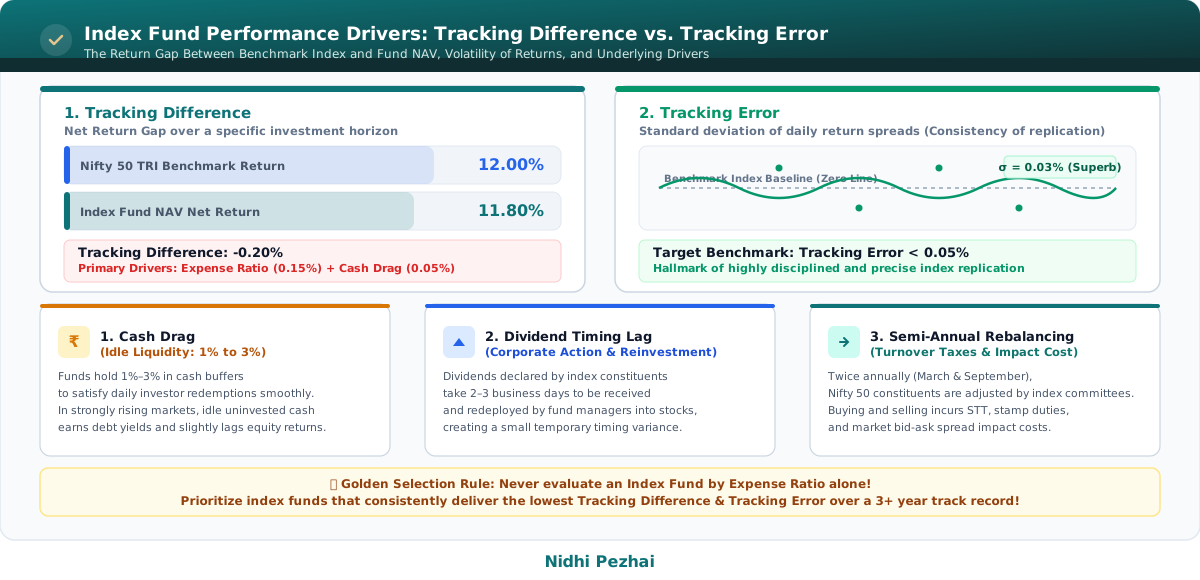
1. Tracking Difference:
- The absolute difference between the total return of the benchmark index (Index TRI) and the fund's NAV return over a given period (e.g., 1, 3, or 5 years).
- Example: If the Nifty 50 TRI gained 15.0% and the index fund delivered 14.80%, the Tracking Difference is -0.20%.
- In a well-managed fund, this difference should closely match the fund's published Total Expense Ratio (e.g., if TER is 0.15%, Tracking Difference should be between -0.15% and -0.20%).
2. Tracking Error:
- The annualized standard deviation of the daily return differences between the fund and the benchmark.
- A low Tracking Error (0.05% or lower) indicates that the fund manager replicates daily index movements consistently without operational lags.
⚙️ Operational Factors: What Causes Tracking Error? (Click to Expand)
- Cash Drag: Index funds hold 1% to 3% in liquid cash or overnight instruments to handle daily investor redemptions. In a rising market, this uninvested cash slightly drags down fund returns.
- Corporate Actions & Dividends: When constituent companies declare dividends, stock splits, or rights issues, there is typically a brief operational lag before cash is received and redeployed into the index basket.
- Index Rebalancing Costs: The National Stock Exchange reconstitutes the Nifty 50 twice a year (March and September). Selling outgoing companies and acquiring incoming constituents incurs brokerage, STT, and impact costs.
Investor Takeaway: When selecting an index fund, look for schemes with a consistently low Tracking Difference and low Tracking Error over 3 years, alongside a sizable AUM (ideally above ₹1,000 Crore) to ensure low transaction impact costs.
5. The Nifty 50 + Nifty Next 50 Strategy: India's Nifty 100 Powerhouse!
A common dilemma for index investors is: "Is a Nifty 50 index fund sufficient on its own, or should I also include Nifty Next 50?"
Understanding the market structure provides clarity:
1. Nifty 50: The Bedrock of Your Portfolio
- Represents India's 50 largest blue-chip leaders (Reliance, TCS, HDFC Bank, Infosys, ICICI Bank, etc.).
- Characteristics: Lower volatility, immense balance sheet strength, institutional liquidity, and direct correlation with India's macro growth.
- The resilient core that anchors your wealth across economic cycles.
2. Nifty Next 50: The Training Ground for Tomorrow's Leaders
- Represents companies ranked 51 to 100 by market capitalization (historically called "Nifty Junior").
- Characteristics: Fast-growing leaders with high operating leverage. As these firms expand, they graduate into the Nifty 50 (past graduates include Titan, Bajaj Finance, and Tata Consumer Products!).
- Blends mid-cap agility with large-cap stability—offering higher growth potential with slightly higher volatility than the Nifty 50.
Why This Combination Outperforms Active Large-Cap Funds:
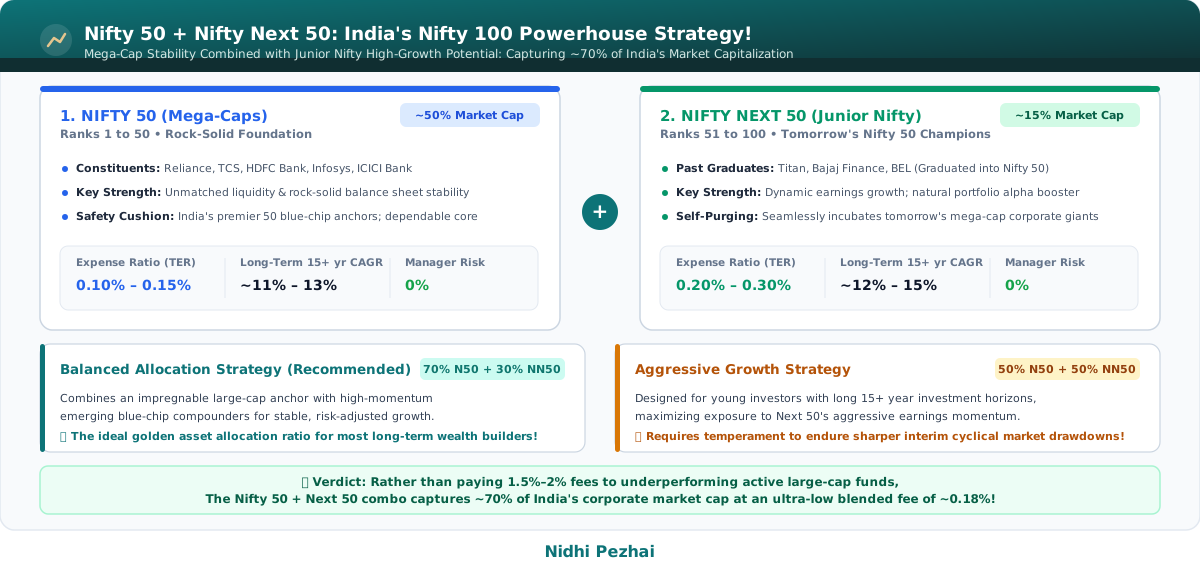
Recommended Portfolio Allocation:
- Balanced / Moderate Horizon:
- 70% Nifty 50 Index Fund + 30% Nifty Next 50 Index Fund
- Delivers solid blue-chip stability alongside an effective alpha boost.
- Aggressive Growth Horizon (15+ Years):
- 50% Nifty 50 Index Fund + 50% Nifty Next 50 Index Fund
- Maximizes long-term growth potential while maintaining large/mid-blend discipline.
6. Where Do Active Mutual Funds Still Make Sense in India?
A balanced approach does not require abandoning active funds entirely. In financial theory: "Active fund managers can only generate persistent alpha in market segments characterized by informational inefficiency."
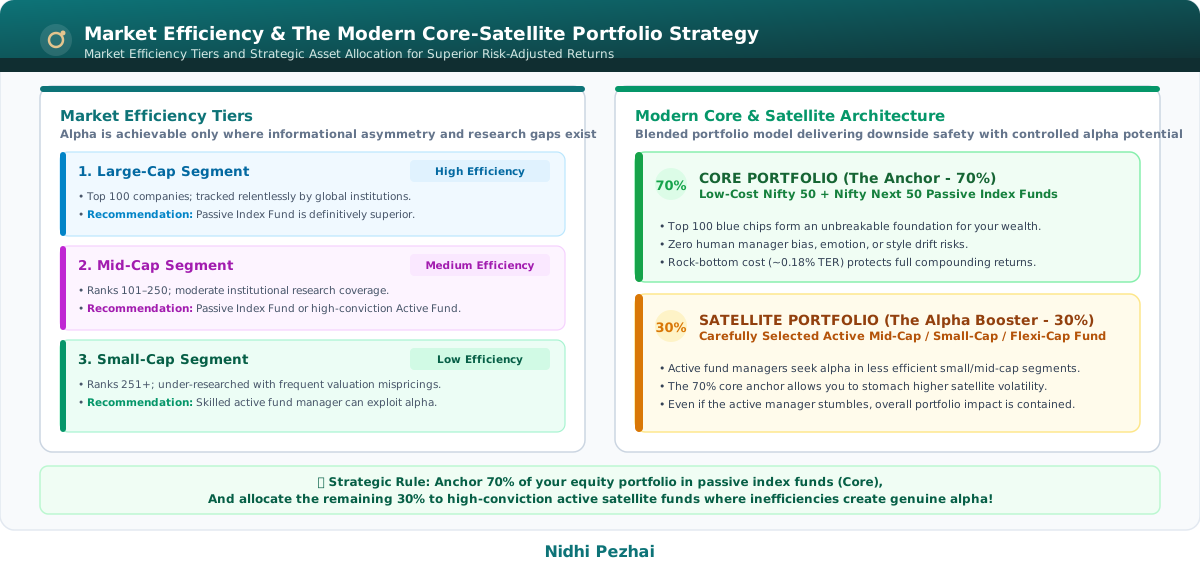
Where Active Management Can Still Add Value:
- Small-Cap Equity Funds:
- Among the 5,000+ listed companies in India, companies beyond the top 250 receive minimal institutional research coverage.
- Many suffer from corporate governance issues, weak accounting, and poor liquidity. Skilled active managers who perform deep on-the-ground forensic accounting can filter out low-quality firms and identify multi-bagger compounders.
- Flexi-Cap / Multi-Cap Funds:
- Experienced fund managers with dynamic allocation mandates can tactically tilt toward large caps during overvalued markets and increase mid/small-cap allocations during corrections.
The Modern Core & Satellite Portfolio:
- Core Portfolio (70% Allocation):
- Low-cost Nifty 50 + Nifty Next 50 Direct Index Funds.
- Eliminates human forecasting errors and anchors 70% of your capital to India's top 100 enterprises.
- Satellite Portfolio (30% Allocation):
- 1 or 2 carefully selected active Mid-Cap, Small-Cap, or Flexi-Cap funds.
- Provides opportunistic exposure to capture alpha in less efficient segments.
7. 4 Common Myths About Index Funds Debunked
SEBI regulations require equity mutual funds to remain at least 80%+ invested in equities. During the 2008 and 2020 crashes, over 95% of active funds fell in tandem with the index.
Market return is not "mediocre." SPIVA data demonstrates that over 80% of active funds fail to even match the market average after deducting fees.
ETFs incur demat charges, broker commissions, and trading bid-ask spreads. For disciplined monthly salary SIPs, Index Mutual Funds provide clean, automated bank execution.
Past performance does not predict future results. Studies show that over 70% of top-quartile active funds fall to bottom quartiles in the subsequent 3 to 5-year cycle.
8. Index Fund Selection Checklist
Before selecting a Nifty 50 or Nifty Next 50 index fund, you should evaluate the fund's Total Expense Ratio (TER), Tracking Difference, Tracking Error, AUM size, and portfolio fit.
To help investors evaluate index fund quality and export results directly to Excel (.xlsx), we have developed an interactive evaluation tool:
Index Fund Selection Checklist
Features 20 comprehensive checkpoints across 6 core categories: Direct vs Regular plans, Total Expense Ratio (TER), Tracking Difference & Error, AUM scale, Core-Satellite portfolio design, and automated SIP discipline.
9. Frequently Asked Questions (FAQs)
Question 1: Do index funds credit the dividends paid by constituent companies?
Question 2: How are index mutual funds taxed in India?
- Short-Term Capital Gains (STCG - held for 12 months or less): Taxed at 20% under Finance Act 2024 provisions.
- Long-Term Capital Gains (LTCG - held for more than 12 months): Gains up to ₹1,25,000 per financial year across all equity investments are 100% tax-free. Gains exceeding ₹1.25 Lakh are taxed at 12.5% flat without indexation.
Question 3: I currently hold active large-cap mutual funds; should I switch them to index funds?
Question 4: What is the difference between Nifty 50 and Sensex index funds?
Question 5: Which is better: an Index ETF or an Index Mutual Fund?
Related Guides & Calculators
- Calculate compounding growth on your SIP: Mutual Fund SIP Calculator
- Plan recurring retirement cash flows: Mutual Fund SWP Calculator
- Plan targeted financial life goals: Goal-Based Investing Calculator
- Design your overall asset allocation: Portfolio Creation Approach
- Compare debt prepayment against investing: Loan Prepayment vs Equity Investment Guide
Conclusion: Compounding With the Market is Greater Wisdom Than Trying to Beat It
The fundamental goal of investing is not to prove that we are smarter than the market; it is to protect our hard-earned savings from inflation and compound our wealth alongside the expansion of our national economy.
Anxiety over whether an active manager will beat or lag the market, and the exhausting habit of chasing top-rated funds every time star ratings change, are the greatest adversaries to long-term compounding.
Set up disciplined SIPs in low-cost Nifty 50 and Nifty Next 50 Direct Index Funds in a 70:30 or 50:50 ratio, and focus your time and energy on your career and family. Over the next 15 to 20 years, India's top 100 enterprises will compound your wealth to extraordinary heights.
Disclaimer: This article is for informational and educational purposes only and does not constitute a specific investment recommendation or financial advice. Mutual fund investments are subject to market risks; read all scheme-related documents carefully before investing, or consult a SEBI-registered Investment Advisor (RIA).